
Data Visualisation and Analysis.
1) Mapping social network
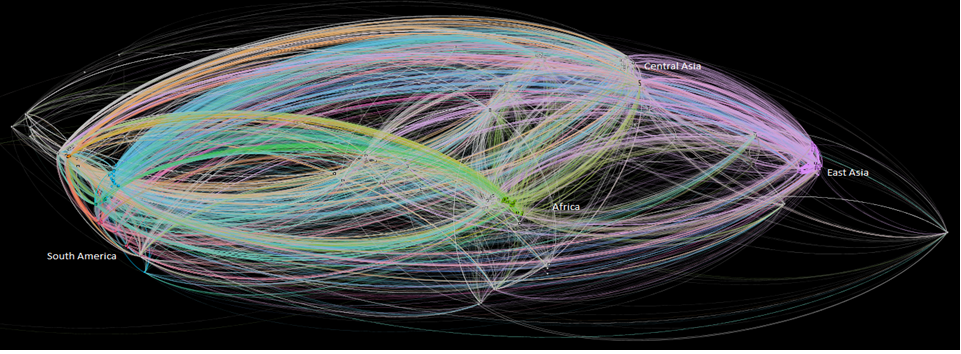
In projects we have used new tools to map and examine social networks. The map above shows a global social network. Each line is a connection between two people on the social network with each person being positioned based on their global position.
We can examine each point in this network, to consider how important an individual is in a social network. There are multiple different measures of importance in a social network with the simplest being the number of links to other people in the network. To the more complex such as how many people pass through you to reach other points on the network. This analysis has enabled us to identify the key players in the networks, enabling advertising and marketing efforts to be focused on these players.
2) Plotting data on maps.
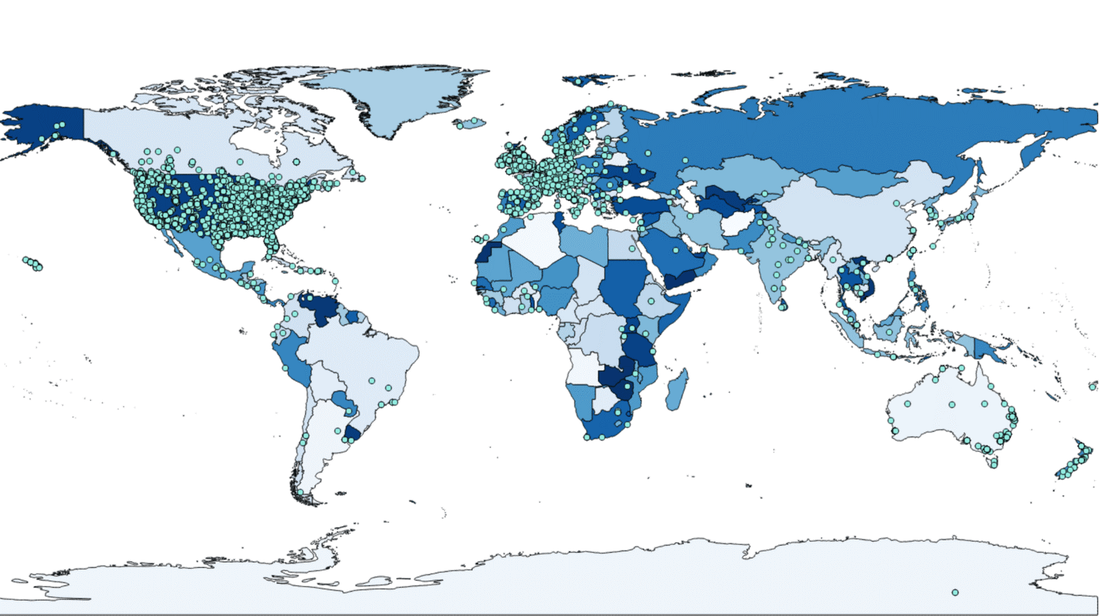
Specific software such as QGIS has been used in projects to plot crowdfunding data. The map above shows all the crowdfunding campaigns of Kickstarter captured in a 3 month period. This mapping can also be used to further analyse data, by comparing the points to regional factors, such as the literacy rate or unemployment.
Specific software such as QGIS has been used in projects to plot crowdfunding data. The map above shows all the crowdfunding campaigns of Kickstarter captured in a 3 month period. This mapping can also be used to further analyse data, by comparing the points to regional factors, such as the literacy rate or unemployment.